By: Eric Rosenbaum | CNBC.com
|
|
|
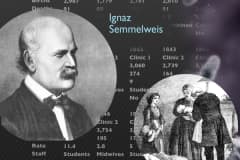
Source: Tableau Software
Detail of Ignaz Semmelweis’s germ theory data chart
Some years ago I was sent by an employer to a one-day course taught by Yale professor emeritus Edward Tufte on presenting data and information. This was a decade before big data was a buzz term and companies in the business of data visualization, like Tableau Software, were going public to a very enthusiastic investor market.
Data visualization is a growing field in which massive amounts of data are measured in quantities reaching exabytes and crunched by an ever-increasing number of Silicon Valley servers ultimately to be presented in visual displays. How the intersection of data, analytics and business evolves is an open question. But according to Tableau CEO Christian Chabot in a presentation to data geeks earlier this year, some of the world's greatest thinkers gained tremendous insight and changed the world simply by organizing and deciphering basic data sets in new ways.
